The Things of the Web.
Hello reader, welcome to the beautiful world of Jupyter Notebook. One of the reasons Jupyter Notebook is so awesome is because it leverages technologies from the web. This allows you to do a large number of things for free, like video, and audio in the Browser.
If you want to hack and understand how the notebook works to fully appreciate it's potential, you have to get familiar with a few technologies of the web.
This chapter is here to give you the necessary basics on web technologies. We will also introduce the core tools you want to use when hacking on the web.
The web browser
One of the key tools you use all the time when working on the web is your web browser. I'm sure you use your browser everyday, but your browser can be both your best ally, or worth enemy. The number of functionalities that your browser has and can do is pretty large. Describing all the things can take days, so we will focus on the basics. I encourage you to learn more about what your browser can do by yourself.
Browser Choice
As a browser of choice I will use Chrome. Chrome comes by default with a lot of baked in tools, so you will not need to install any extensions. The interface will also be consistent regardless of the OS you are using.
If you are more a fan of Firefox, I would suggest you to install the developer edition. It comes preconfigured with many defaults. It is possible to set-up default firefox to behave like developer edition, but it can take some time.
Your other major browsers are Safari on MacOS, and Internet Explorer for Windows. Unfortunately, I am not familiar with either of them. As far as I know you can make most of what we will do in Safari. You might just have to enable developer mode in the advanced preferences.
Developer tools.
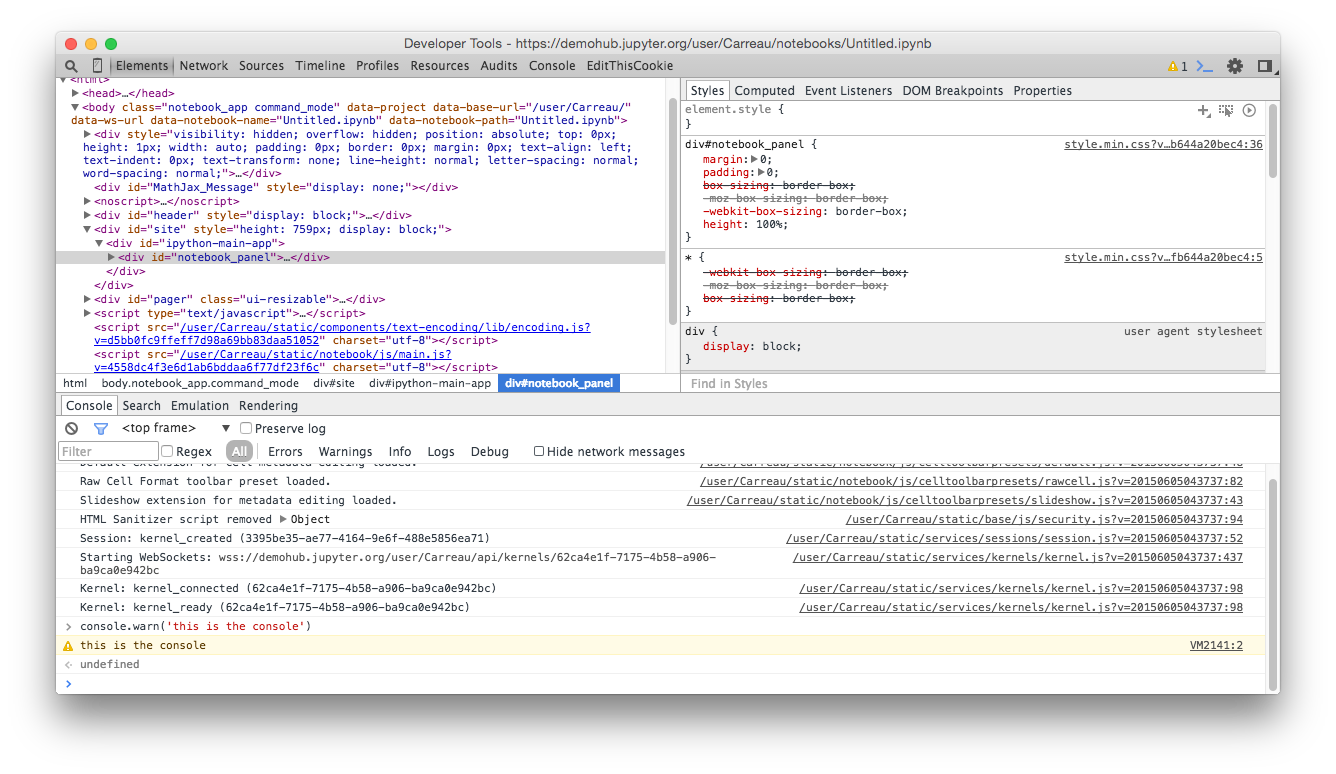
The developer tools are a number of panels that allow you to interact with the web page in a way much different than usual browsing. You can see that as a powerful debugger that allows you to modify and inspect the running page live.
To open the developer tools in Chrome, go to the View > Developer > Developer Tools.
I suggest you learn the keyboard shortcut to open the Dev Tools. It's probably one of the shortcuts you will use the most (with switching windows) in this tutorial.
Ok, so let's look at different areas of the developer tool you will be interested in.
DOM Tree
The far left tab, named Elements, is the tab that allow you to view the current structure of the DOM.
We won't really dive into what the DOM is. In a first approximation, the DOM is the current state of the HTML. You want to look at this tab if you are trying to inspect or modify the structure of the DOM.
One of the useful things is the small magnifying glass even more on the left than the Elements.
It allows you to click on a visual element in a page, and get it selected on the tree view.
Ok, let's try to mess a bit with the DOM. In the tree view on the upper left, try to double click and edit some element of the DOM. You will see that when you hover the tree, the relevant part on the view will highlight. Try to figure out where the cell, the pager, and toolbar are in a notebook page.
CSS inspector.
On the right of the DOM Tree view is the CSS inspector. The CSS inspector allows you to observe and modify the CSS rules that apply to the currently selected element. It is basically these rules that describe the layout and appearance of the notebook page.
Javascript console
The last part of the Devtools that we will use today is the javascript console. It is basicaly like an IPython console prompt, though it runs in the context of the page, and accepts only javascript.
It is different than usual REPL in the sense that the javascript on the page is continually executing and does not Pause while you type at the prompt.
Let's try the basic of the console.
> console.log('Hello Jupyter Notebook')
You can also run a task in the background.
> setInterval(function(){console.log('hi there')}, 3000)
This will print every 3 seconds. When it annoys you enough, refresh your page, all your changes will be gone.
Let's try something more visual:
> $('.cell:even').slideUp('slow').slideDown('slow')
We won't get into details, but you did something equivalent to numpy broadcasting. You applied a function to a collection of elements of the DOM.
Browser lies
You are all aware that there are 2 things hard in programming: naming things, caching, and off by one errors. Unfortunately we have to deal with all of them in developing for the web. There are a few extensions that allow you to flush cache and reload the page at the same time. But one of the easiest options is to deactivate Browser caching while your developer tools are open.
To do so with your dev tools open, click on the setting menu (gear icon on the top right) and disable caching while you are developing.
This will most likely prevent you from madness as it is easy to assume when you reload the page that you get the last version of the javascript you just saved.
Keep in mind that opening the devTools might slow down your browser. You might not see it, or feel it. Though it might have effect in the case of timing bugs and race conditions. (also known as Heisenbugs by quantum physicists). Opening the devTools may make some bugs disappear.
Also, by quantum physicist I of course mean people that are both a superposition of Physicist and non-Physicist until you watch them.
One last tricky-bit is that $, _, and a few other function/methods might not be and behave the same in console and in scripts. We'll see what these are in next chapter.
Conclusion
Well, you get the basics for the tools. There is much more to say but you should have enough knowledge to mess around. The goal here is to give you enough to get started. Next step is to introduce not the tools themselves but some common utilities, and non-written things that are common knowledge among web developers.